Course Progress Graph
The Course Progress Graph will give you a snapshot of how well your students are performing in each lesson and how far they've come in the course. You can scroll sideways to see students' progress on each lesson, and even hover over each lesson for more detailed information. To view this chart, follow the next steps:
- Go to Classes and select your class.
- Click Reports.
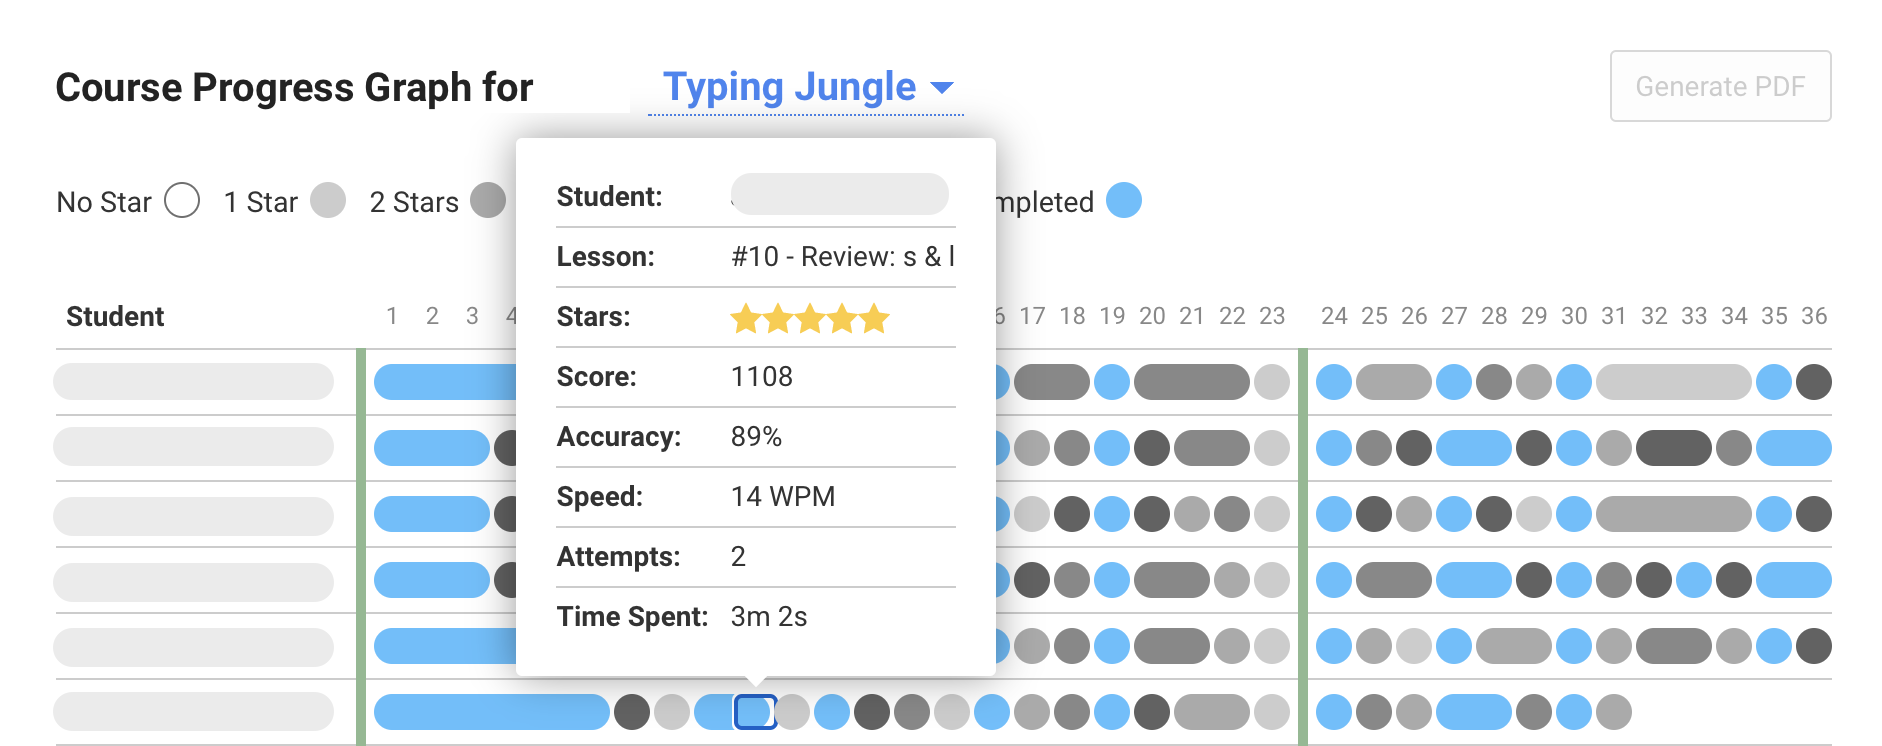
- Click Course Progress Graph. You will see your students listed alphabetically by their last name in the column on the left side, and the lesson number on the top row of the chart. The blue circles represent a completed lesson in which the student has earned 5 stars. Any shade of grey represents 4 stars or less. You can hover over each lesson to see more information about the student's performance. Ideally, you will see a completely blue chart indicating that every student repeated each lesson until they achieved 5 stars and they have each finished all the lessons up to the point you assigned.